- Figure 1
- Figure 2
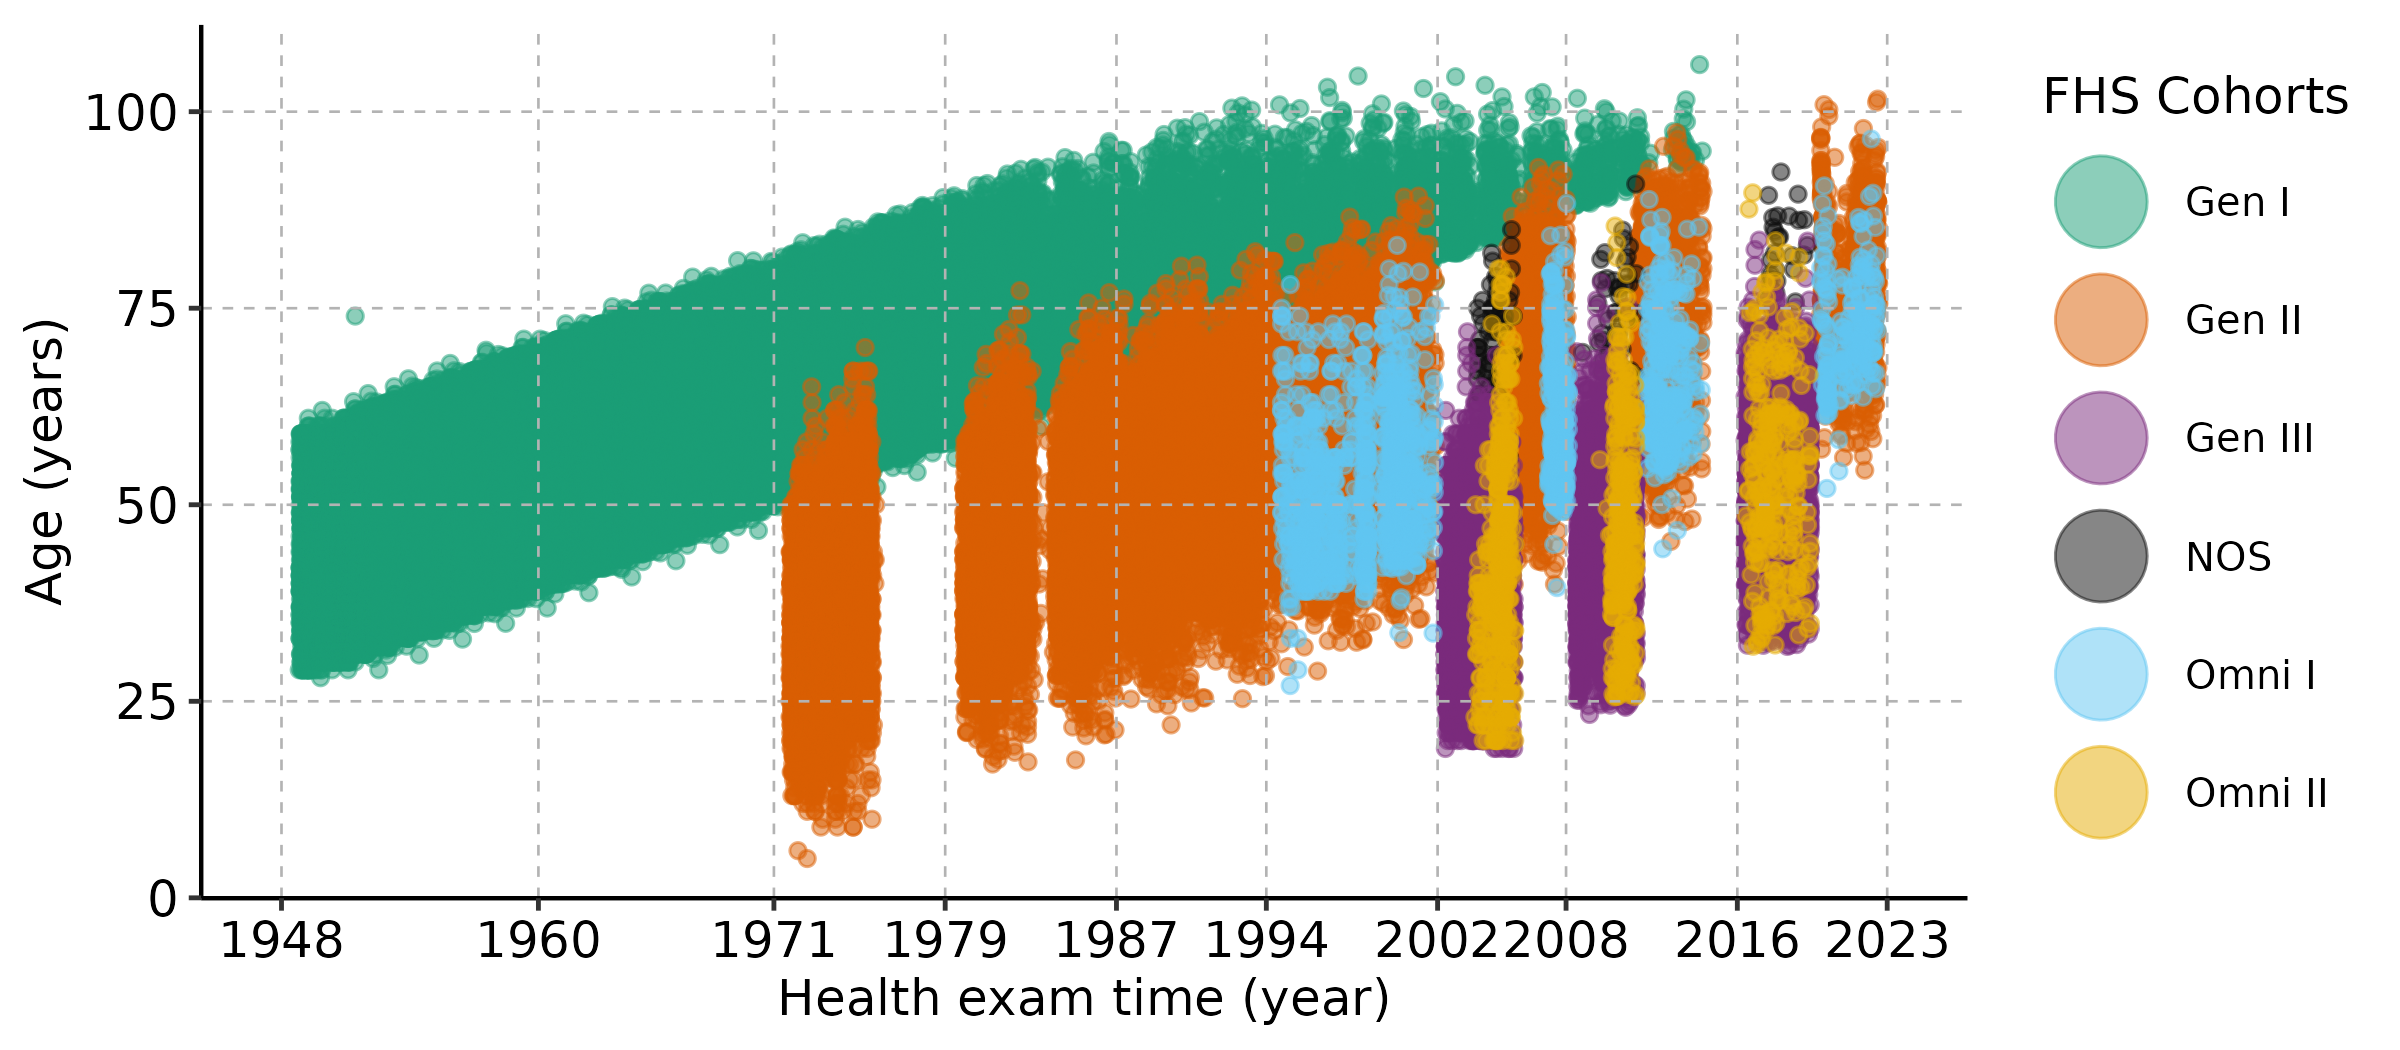

Figure 1-2. The age distribution of FHS participants at each health exam (core exam) across all six cohorts: Original Cohort (Gen I, n = 5209), Offspring Cohort (Gen II, n = 5124), Generation 3 Cohort (Gen III, n = 4095), New Offspring Spouse Cohort (NOS, n = 103), Omni 1 Cohort (n = 506), and Omni 2 Cohort (n = 410). The numbers in Figure 2 represent the health exam order of each FHS cohort. Note: Unlike the other three generations, Omni 1 and Omni 2 were independent and have no generational relations.
| Cohort | Number | Exam Cycles | Description |
|---|---|---|---|
| Gen I | 5209 | 32 | Also known as the Original cohort Only cohort with each exam/interview cycle 2 years apart No remaining survivors |
| Gen II | 5214 | 10 | Also known as the Offspring cohort They are generally the offspring of the Gen I participants Each exam/interview cycle 4 – 5 years apart |
| Gen III | 4095 | 3 | They are generally the offspring of the Gen II participants (i.e. grandchildren of Gen I) Each exam/interview cycle 4 – 5 years apart |
| NOS | 103 | 3 | They are generally the spouses of the Gen II participants Each exam/interview cycle 4 – 5 years apart Follows the exam schedule of Gen III |
| Omni I | 506 | 4 | First multiracial cohort Each exam/interview cycle 4 – 5 years apart Exam Cycle 1 was in sync with Gen II’s Exam Cycle 6 |
| Omni II | 410 | 3 | Second multiracial cohort Unrelated with Omni I Each exam/interview cycle 4 – 5 years apart |
FHS Cohort Health Exam Dates and Age Ranges (Oct 2023)
Table 1. Original Cohort (idtype=0)
| Exam # | Exam Date Range | Age Range | Mean Age | Total # of Participants |
|---|---|---|---|---|
| 1 | 1948-1953 | 28-74 | 44 | 5209 |
| 2 | 1950-1955 | 31-65 | 46 | 4792 |
| 3 | 1952-1956 | 32-67 | 48 | 4416 |
| 4 | 1954-1958 | 34-69 | 50 | 4541 |
| 5 | 1956-1960 | 37-70 | 52 | 4421 |
| 6 | 1958-1963 | 38-72 | 54 | 4259 |
| 7 | 1960-1964 | 40-74 | 55 | 4191 |
| 8 | 1962-1966 | 42-76 | 57 | 4030 |
| 9 | 1964-1968 | 44-78 | 59 | 3833 |
| 10 | 1966-1970 | 46-80 | 61 | 3595 |
| 11 | 1968-1971 | 49-81 | 62 | 2955 |
| 12 | 1971-1974 | 50-83 | 64 | 3261 |
| 13 | 1972-1976 | 53-85 | 66 | 3133 |
| 14 | 1975-1978 | 55-88 | 68 | 2871 |
| 15 | 1977-1979 | 57-89 | 69 | 2632 |
| 16 | 1979-1982 | 59-91 | 70 | 2351 |
| 17 | 1981-1984 | 61-93 | 72 | 2179 |
| 18 | 1983-1985 | 63-94 | 74 | 1825 |
| 19 | 1985-1988 | 65-96 | 75 | 1541 |
| 20 | 1986-1990 | 67-97 | 77 | 1401 |
| 21 | 1988-1992 | 69-99 | 79 | 1319 |
| 22 | 1990-1994 | 72-101 | 80 | 1166 |
| 23 | 1992-1996 | 73-101 | 81 | 1026 |
| 24 | 1995-1998 | 76-103 | 83 | 831 |
| 25 | 1997-1999 | 78-104 | 84 | 703 |
| 26 | 1999-2001 | 79-103 | 86 | 558 |
| 27 | 2002-2003 | 82-104 | 87 | 414 |
| 28 | 2004-2005 | 84-104 | 89 | 303 |
| 29 | 2006-2007 | 85-102 | 91 | 218 |
| 30 | 2008-2010 | 88-102 | 92 | 141 |
| 31 | 2010-2011 | 90-99 | 92 | 91 |
| 32 | 2012-2014 | 93-106 | 96 | 40 |
Table 2. Generation 2 Cohort (idtype =1)
| Exam # | Exam Date Range | Age Range | Mean Age | Total # of Participants |
|---|---|---|---|---|
| 1 | 1971-1975 | 5-70 | 36 | 5124 |
| 2 | 1979-1983 | 17-77 | 44 | 3863 |
| 3 | 1983-1987 | 18-77 | 48 | 3873 |
| 4 | 1987-1991 | 22-81 | 52 | 4019 |
| 5 | 1991-1995 | 26-84 | 55 | 3799 |
| 6 | 1995-1998 | 29-86 | 59 | 3532 |
| 7 | 1998-2001 | 33-90 | 62 | 3539 |
| 8 | 2005-2008 | 40-93 | 67 | 3021 |
| 9 | 2011-2014 | 46-98 | 71 | 2430 |
| 10 | 2019-2022 | 55-102 | 77 | 1501 |
Table 3. Generation 3 Cohort (idtype =3)
| Exam # | Exam Date Range | Age Range | Mean Age | Total # of Participants |
|---|---|---|---|---|
| 1 | 2002-2005 | 19-71 | 40 | 4095 |
| 2 | 2008-2011 | 24-78 | 47 | 3411 |
| 3 | 2016-2019 | 32-84 | 54 | 3171 |
Table 4. New Offspring Spouse Cohort (idtype=2)
| Exam # | Exam Date Range | Age Range | Mean Age | Total # of Participants |
|---|---|---|---|---|
| 1 | 2002-2005 | 47-85 | 65 | 103 |
| 2 | 2008-2011 | 53-90 | 70 | 68 |
| 3 | 2016-2019 | 60-93 | 75 | 56 |
Table 5. Omni 1 Cohort (idtype=7)
| Exam # | Exam Date Range | Age Range | Mean Age | Total # of Participants |
|---|---|---|---|---|
| 1 | 1994-1998 | 27-78 | 52 | 506 |
| 2 | 1999-2001 | 33-83 | 55 | 405 |
| 3 | 2007-2008 | 39-89 | 62 | 298 |
| 4 | 2011-2014 | 44-88 | 66 | 301 |
| 5 | 2019-2022 | 52-96 | 72 | 197 |
Table 6. Omni 2 Cohort (idtype=72)
| Exam # | Exam Date Range | Age Range | Mean Age | Total # of Participants |
|---|---|---|---|---|
| 1 | 2003-2005 | 20-80 | 43 | 410 |
| 2 | 2009-2011 | 25-85 | 48 | 321 |
| 3 | 2016-2019 | 32-89 | 54 | 294 |